Instagram Engagement Rate: What's Good in 2026 and How to Improve It
Engagement rate is the number most people use to judge whether an Instagram account is healthy. Follower counts can be bought or inflated; real engagement is much harder to fake. This guide explains what the number really tells you, how to calculate it, what counts as good for your size, and the changes that actually move it.
What engagement rate measures
Engagement rate shows what share of an account's audience reacts to a typical post. The common public version adds up the likes and comments on recent posts, takes the average per post and divides it by the follower count.
A 3% rate means an average post gets reactions equal to 3% of the audience. It doesn't tell you who those people are, but it is a fair signal of whether the audience is real and paying attention. That is why brands check it before a collaboration, and why creators use it to see whether their content is landing.
Instagram itself uses many more signals, such as saves, shares, watch time and how quickly a post gets its first reactions. You can only see those in Insights for your own account. Likes and comments are visible on any public account, which is what makes engagement rate useful for comparing accounts.
How to calculate it
The standard formula is:
Engagement rate = (average likes + average comments) ÷ followers × 100
Use the last 12 posts or so. Fewer than that and one unusual post can swing the result; many more and you are measuring an account that no longer exists. Leave out a post if it is a giveaway or a paid boost that clearly behaves differently from normal posts.
Worked example: an account with 8,200 followers, averaging 260 likes and 18 comments, has (260 + 18) ÷ 8,200 × 100 = 3.39%. You can check any numbers in seconds with our free engagement rate calculator, and other ways to calculate it are covered below, such as engagement by reach.
Other ways to calculate engagement rate
There are several formulas, which is why different tools show different numbers for the same account. The by-followers formula above is the only one anyone can use on a public account; the others need numbers only the account owner can see.
- By reach: (likes + comments + saves + shares) ÷ reach × 100. It shows how strongly the people who saw a post reacted. Only the account owner can see reach, in Insights.
- By views: (likes + comments) ÷ views × 100. Useful for comparing reels with each other, since view counts are public on reels.
- Including saves and shares: adds two strong signals of value, but both are private on most posts.
- Per post or per day: some agencies report engagement per post, others total engagement over a period. Compare like with like.
Worked example by followers: an account has 20,000 followers. Over its last 12 posts it averaged 540 likes and 60 comments. (540 + 60) ÷ 20,000 × 100 = 3%.
Why tools show different rates
They use different posts, different time windows or different formulas. Some include reels, some don't; some leave out the newest posts that are still collecting likes. To compare accounts fairly, use the same tool and the same method for all of them.
Mistakes to avoid when calculating
- Mixing very old posts with new ones.
- Including a pinned post from years ago.
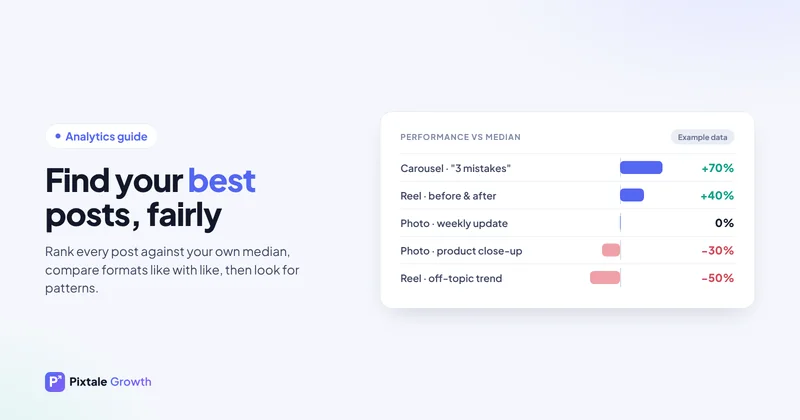
- Letting one viral post lift the average; look at a typical post too.
- Including a post that is only a few hours old and still collecting reactions.
What is a good engagement rate?
It depends heavily on account size. Small accounts usually have closer relationships with their followers, so their rates are higher. As an audience grows, the share who react to any one post falls. Rough ranges many analysts work with:
- Under 10K followers: about 2.5% to 5.5%
- 10K to 100K: about 1.5% to 3.5%
- 100K to 1M: about 1% to 2.5%
- Over 1M: about 0.5% to 1.8%
Treat these as a starting point rather than a rule. Niche matters too: a focused community around a hobby, a city or a profession will often beat a broad lifestyle account of the same size. Compare yourself with accounts of a similar size in a similar niche, not with the biggest names in your field.
Engagement rate by country and audience
The formula is the same everywhere, but what is normal varies with the audience. Accounts that speak to a tight local community, such as a café in Jaipur, a salon in London or a realtor in Austin, often see higher rates than national brands, because followers know the business personally. Accounts that post in more than one language or serve followers across several time zones may see slightly lower rates, simply because each post lands at a good time for only part of the audience. If that is you, read our guide on the best time to post.
Why your rate might be falling
The usual causes are simple:
- Posting less often. Followers forget you and the algorithm has less to work with.
- A run of the wrong format. If your audience loves reels and you post three static images in a row, the average drops.
- Captions with no reason to reply. Fewer comments lower the rate directly.
- A wave of new followers. A viral post can bring thousands of people who came for that one post. The account grows but the rate falls.
- Inactive or fake followers. Old giveaways and bought followers inflate the denominator without ever engaging.
A falling rate is not always bad news. If it falls because you gained many followers, your total interactions may still be rising. Look at both.
12 ways to improve your engagement rate
1. Make more of what already works
Look at your best recent posts and find what they share: format, topic, opening line or time of day. Finding your best-performing posts walks through this. It is the single highest-return habit on this list.
2. Hook people in the first second
For reels, the opening frame and the first line of on-screen text decide whether someone keeps watching. Lead with the result, the surprise or the question, not a slow introduction.
3. Give people a reason to comment
End captions with a real, specific question. "Which one would you pick, 1 or 2?" gets far more replies than "Thoughts?". Comments are a stronger signal than likes and lift the rate directly.
4. Reply to comments quickly
Answering in the first hour keeps the conversation going and shows new visitors that the account is alive.
5. Post consistently
A steady rhythm of three or more posts a week keeps you in followers' feeds. Pick a pace you can sustain for months, not one you will abandon after two weeks.
6. Test the format
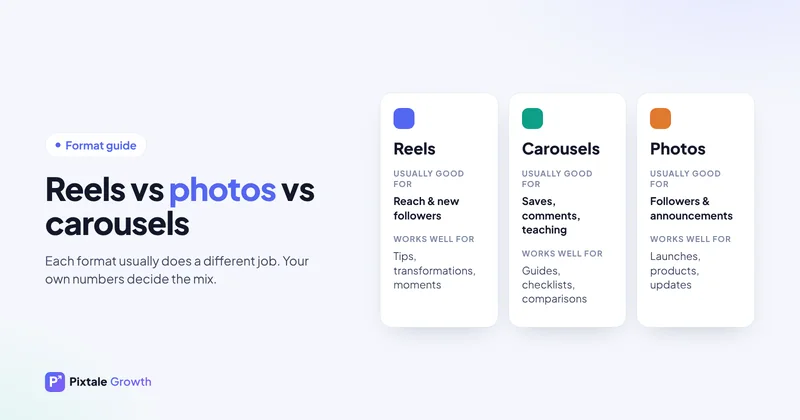
On many accounts reels reach further than photos, but not on all. Compare them on your own numbers with our guide to reels versus photos.
7. Use carousels for saves
Step-by-step tips, before-and-after sets and checklists are saved and shared more than single images, and carousels give people more reasons to stay on the post.
8. Post when your audience is online
Early reactions help a post reach more people. Use our best time to post tool to find starting times for your audience's country, then confirm them with your own results.
9. Stay in your niche
Every off-topic post teaches a share of your audience that your content isn't for them. A clear theme keeps the right people engaged.
10. Use Stories to warm people up
Polls, question boxes and sneak peeks in Stories remind followers to check your next post and give you ideas for content they want.
11. Collaborate with similar accounts
Collab posts and shout-outs with accounts of a similar size bring in followers who already like your type of content, which protects your rate as you grow.
12. Clean up obvious junk followers
If you once ran giveaways or bought followers, removing clearly fake accounts can bring the rate back to an honest level. Don't obsess over it; focus on the content first.
Engagement rate is one of several numbers worth tracking. Our guide to social media metrics covers the 15 that matter, with formulas and how to pick your KPIs.
Also on Facebook? Facebook rates work differently, so see our guide to what is a good engagement rate on Facebook.
Engagement rate vs reach and impressions
Engagement rate is often confused with reach, but they answer different questions. Reach is how many different accounts saw a post. Impressions count every view, including repeat views by the same person. Engagement rate by followers, the version on this page, tells you how strongly your audience reacts relative to its size.
If you own the account, Instagram Insights also lets you work out engagement rate by reach: interactions divided by the number of accounts reached. This is useful for reels, which often reach many people who don't follow you. A reel can have a modest rate by followers but a strong rate by reach, which means it is doing its job of finding new people. Use the follower-based rate to compare accounts and the reach-based rate to judge individual posts on your own account.
Common mistakes when measuring engagement
- Using too few posts. Three posts can swing wildly; use around twelve.
- Including giveaways. "Comment to win" posts inflate comments and make the account look far more engaged than it is.
- Comparing different sizes directly. A 5K account and a 500K account live in different ranges. Compare each with its own range.
- Ignoring comment quality. Fifty comments that say "nice" mean less than ten real questions. Read them.
- Measuring once. One reading is a snapshot. Check monthly and look at the trend.
How brands use engagement rate
When a brand looks at a creator, a common first check is engagement rate against the size ranges above, followed by the comments themselves: are they real sentences from real people, or a stream of emojis? A creator with 25K followers and 4% engagement often delivers more genuine attention than one with 200K and 0.6%. If you are a creator, keeping your rate healthy is the best argument for better deals.
Check any account in seconds
You can see the engagement rate of any public account, along with how it compares with similar-sized accounts, its top posts and its best posting times, using the free Pixtale Growth analyser or the free Instagram profile audit. No login is needed.
FAQ
What is a good engagement rate on Instagram in 2026?
It depends on size. Under 10K followers, about 2.5% to 5.5% is typical; 10K to 100K about 1.5% to 3.5%; 100K to 1M about 1% to 2.5%; over 1M about 0.5% to 1.8%.
How do I calculate my Instagram engagement rate?
Add the average likes and comments per post over your last 12 posts, divide by your follower count and multiply by 100.
Is 3% a good engagement rate on Instagram?
Yes for most accounts. It is healthy for accounts between 10K and 100K followers and above average for accounts over 100K.
Do reels have a higher engagement rate than photos?
Often, because reels reach non-followers too, but it varies by account. Compare both formats on your own recent posts.
Why did my engagement rate drop?
Common causes are posting less, a run of formats your audience ignores, captions that don't invite replies, or a wave of new followers from a viral post.
Why do tools show different engagement rates?
They use different posts, different time windows or different formulas. Compare accounts with the same tool and method.
How can I see my engagement rate on Instagram?
Instagram does not show engagement rate as one number. Add up the likes and comments on recent posts, divide by your followers and multiply by 100, or use our free engagement rate calculator to do it for you.
Check any Instagram account free
AI rating, niche, engagement rate and top posts for any public profile. No login.
Analyse an account